Bye Week
Betting On NFL Teams After The Bye Week
What is the "bye week"?
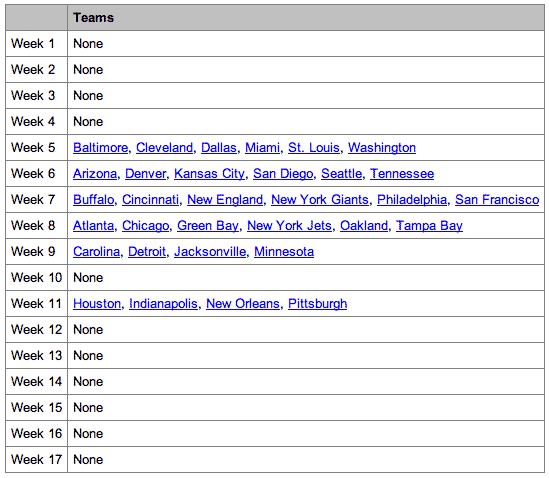
NFL handicappers have been debating the effects of the bye week for over 20 years now. Since the 1990 NFL season, each team gets one week off, called a bye, sometime during weeks 4-10.
Any reasonable person probably assumes teams coming off the bye week do well, thanks to an additional week for the coaches to prepare in the film room, extra time on the practice field, and the chance for a team to get healthy (heal injuries).
While overall since 1990 this has been the case, it’s only by a thin margin (52.7%), and during the past season and a half, teams coming off a bye are a game below .500 at 21-22 for a win percentage of 48.8%.
Bye week ATS stats.
While I’m not a massive fan of ATS data (against the spread data), for reasons you can read about in my article: The Truth about ATS stats, let’s go ahead and look at the most recent year’s stats, both the straight up and ATS, to see how teams coming off their bye week fared.
| ATS: | 20-12 |
|---|---|
| Straight: | 18-13-1 |
| ATS: | 15-16-1 |
|---|---|
| Straight: | 16-16-0 |
| ATS: | 6-5-0 |
|---|---|
| Straight: | 5-6 |
*2010 season, through the completion of week #8
Blind backing teams coming off the bye showed some promise in the 2008 season, but since then has been running about even. Over the course of doing research on this topic, I stumbled across dozens of forum posts claiming to have found the holy grail of NFL bye week betting. I won’t cover them all, but here are a few examples of trends:
- Trend 1: Teams coming off a bye that average 1.6 or more offensive holding penalties against them per game are 65-29 (69.1%) ATS. (data source: 2001-2007 seasons)
- Trend 2: Teams who give up the lead late in the fourth quarter, or lose in OT, in the week before their bye, have responded well after the bye going 39-14 (73.6%) ATS. (data source: 1994-2007 NFL seasons).
- Trend 3: Road favorites of 55% or more, since the start of the bye week, have gone 423-201 (67.8%) ATS. (data source: 1990 to 2008 NFL season).
Once again, this is only a small sample of data I came across, and I haven’t bothered to verify how accurate the numbers are, for the simple reason that data from the 1990’s is almost entirely irrelevant to this discussion. If you’re not sure why, read my article on “what to do when the line moves” where I give an easy to understand explanation of efficient market theory in sports betting.
The first of these trends was vaguely interesting and can be reasonably explained. Personally, because that stat would take such a long time to research, and because that data-mined trend is likely 80/20 in variance/advantage, and the market would most certainly adjust to it if there was any merit, I decided at least for now to leave it alone.
The second trend is much more interesting, but considering the data source is 53 games over 14 season, and uses subjective data as well, this is another one I’m not going to give too much credit to.
The third stat, however, really caught my interest, and its one I decided to research further.
The first thing I looked at is teams coming off the bye: how many are favored and how many are underdogs. In the 2007/08 season, there were 18 favorites and 14 dogs; in 2008/09, 16 favorites and 16 dogs. With the distribution close enough to equal, I decided to dig further. In order to avoid “data mining”, as home favorites / road favorite should make no difference – I decided to look only at favorites “period”, giving no consideration to home/away. Here is what I came up with:
Favorites coming off their bye week:
| ATS: | 13-5 |
|---|---|
| Straight: | 14-4 |
| ATS: | 12-4 |
|---|---|
| Straight: | 14-2 |
| ATS: | 9-8-1 |
|---|---|
| Straight: | 13-5 |
| ATS: | 3-2-1 |
|---|---|
| Straight: | 4-2 |
*2010 season, through the completion of week #8
This is a perfect example of why ATS stats are dangerous to follow. The majority, let’s say 75% or more, of ATS stats are the result of variance (randomness). As more games are played, sample sizes increase and the win/loss against the spread standings regress towards the mean of 50/50. On the other hand, in the 25% of cases where ATS were performing better than 50/50 for a reason other than variance, this relates to market efficiency (the line is not correct).
Success
Create your account at Bookmaker.eu now
In time, and rather quickly in today’s betting market, the odds makers and sharp bettors will correct their handicapping models and, going forward, the point spreads get set accurately, and therefore once again it is a 50/50 proposition. The problem with ATS based systems that call for a bet regardless of where the line is set: is that most likely now, and if not so next week or the week after, you’re making a 50/50 bet and getting paid less than 1:1.
For more on all this, see our article “The Truth about ATS Stats”.
This is a topic that I won’t dig too much further into. I’ll hint that after doing some research into margins of victory against expected margins of victory, teams that are favored are in fact performing much better than expected after the bye week, where underdogs actually appear to be disadvantaged by the bye week. Keep in mind that this data is useless against the spread, because the market is always adjusting itself.
Final thoughts on betting on the bye week.
The reason for telling you this, and for writing this article in the first place, is to help you to better understand posted point spreads in a given week that don’t make sense. For example, after reading this you might avoid betting against a favorite coming off a bye, or on a dog coming off a bye, in cases where the “line appeared off”.
The above is a rather simplistic analysis of the “effects of the NFL bye week”. It should provide you with a decent starting point to research further. One area that you may want to look at is how certain QBs and certain head coaches have performed coming off a bye. Of course, this will have sample size issues, but this and other data are small puzzle pieces useful to make an analysis.
Unfortunately, as I mentioned in the intro, “NFL handicappers have been debating the effects of the bye week for over 20 years now”, so both my gut and my brain tell me we have a little more work to do on quantifying it. If you’re looking for one area where you might find an edge over large bettors creating the market, perhaps focusing on “NFL bye weeks” would be a good place to start.
It would be quite the task, but if you do decide on making an attempt to tackle it, we wish you the best of luck.